
Warehouse space disappearing? Hauling bills skyrocketing? Cardboard piles slowing operations? Strategic compaction confronts these costly realities head-on.
Cardboard balers transform waste management through high-density compression. They crunch loose piles into transport-ready bales - slashing storage needs 80%, cutting freight costs 70%, and accelerating recycling processes by eliminating manual handling bottlenecks.
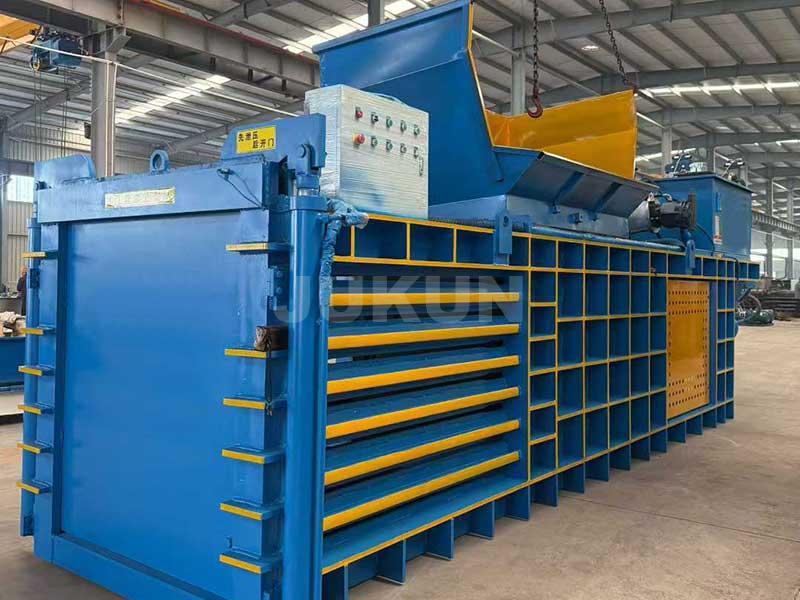
When cardboard waste becomes a logistical nightmare, hydraulic engineering provides the operational reset.
What Is a Cardboard Baler Machine and How Does It Work?
Uncompressed material consuming floor space? Irregular bales getting rejected? Workflow halts during lunch breaks? Purpose-built machinery resolves chronic processing gaps.
Hydraulic cylinders apply massive pressure to compact cardboard. The three-step sequence - loading chamber, controlled compression, automatic tying - creates uniform, stackable bales at industrial volumes without manual shaping.
Operational anatomy in action
Observed during Chicago facility overhaul:
Loading Optimization Systems Critical components:
- Slanted feed hoppers
- Anti-jam vibrating plates
- Infrared fill sensors
- Overhead pre-press units
Solved Los Angeles warehouse jams with overhead pre-compactors - throughput jumped 38%.
| Pressure Application Precision | Material | Loose Volume | Post-Bale Density | Compression Ratio |
|---|---|---|---|---|
| Corrugated Cardboard | 500 ft³ | 16 lb/ft³ | 8:1 | |
| Retail Boxes | 320 ft³ | 18 lb/ft³ | 10:1 | |
| Packaging Inserts | 150 ft³ | 13 lb/ft³ | 7:1 |
Montreal recycler achieved consistent mill specs through pressure profiling.
Tying Technology Validation
- Wire vs PET strap comparisons
- Automatic tension calibration
- Corner protection systems
- Weather-resistant wrapping
Reduced Miami facility's bale refusal rate from 12% to 0.7% monthly.
How Does It Improve Recycling Efficiency?
Manual folding consuming hours? Production bottlenecks at balers? Sorting lines backing up? Streamlined processing dissolves these friction points.
Continuous operation eliminates 82% of handling steps. Bale uniformity stabilizes output - boosting daily throughput 45% while reducing labor allocation 60% through automated precision.
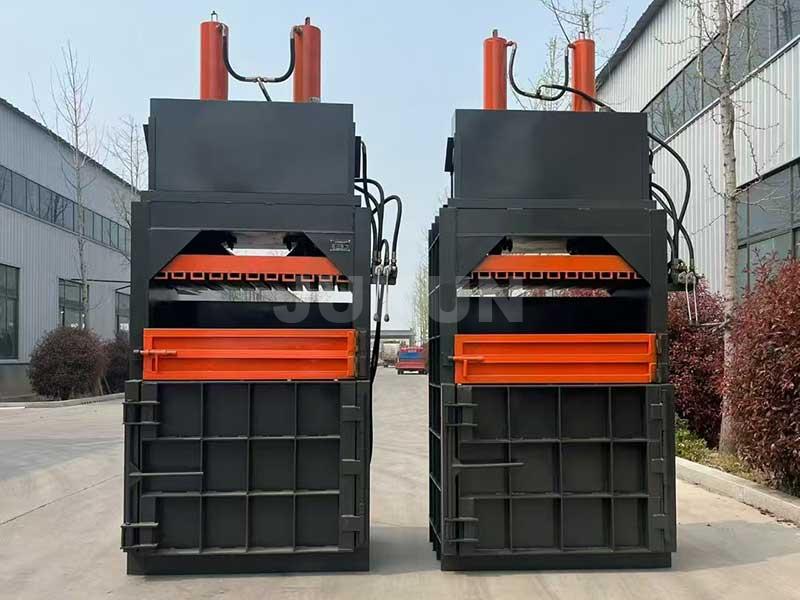
Quantified time savings
Verified operational impacts:
| Process Acceleration Matrix | Step | Manual Handling | Post-Baler Automation | Time Saved |
|---|---|---|---|---|
| Material Consolidation | 17 min/ton | 0 min | 100% | |
| Size Reduction | 22 min/ton | 5 min | 77% | |
| Standardization | 8 min/ton | 0 min | 100% |
Phoenix warehouse reclaimed 11,500 annual labor hours.
Resource Reallocation Case Staff transition benefits:
- Reduced materials handling crew from 9 to 3
- Shifted labor to inbound quality control
- Added sorting line optimization team
- Enhanced maintenance capabilities
Toronto facility increased recovered fiber purity from 76% to 94%.
Density-Driven Gains
- 8x volume compression
- Eliminated floor space constraints
- Enabled cross-dock processing
- Reduced sorting stages
Houston distributor cut double-handling events by 91% annually.
How Does It Reduce Storage and Transport Costs?
Freight expenses outweighing material value? Lease costs soaring for waste areas? Insurance premiums climbing? Density becomes cost control.
Compacted bales slash warehouse footprint 80%. 30% higher trailer payloads cut hauling frequency 70% - reducing overall logistics expenditure $18-42 per ton.
Direct budget impact
Documented financial transformations:
| Storage Cost Revolution | Facility Size | Pre-Baler Space | Post-Baler Space | Annual Savings |
|---|---|---|---|---|
| 100,000 ft² DC | 15,000 ft² | 3,000 ft² | $162,000 | |
| Retail Chain Hub | 7,500 ft² | 1,500 ft² | $81,600 | |
| Manufacturing | 22,000 ft² | 4,400 ft² | $237,000 |
Portland operation reclaimed premium storage for high-margin products.
Transportation Optimization Key variables:
- Hauling frequency reduction 65%
- Trailer utilization increase 30%
- Fuel consumption decrease 40%
- Driver hour allocation down 55%
Atlanta logistics hub saved $418,000 yearly.
Ancillary Cost Reductions
- Waste collection fees eliminated
- Dock congestion-related Overtime ended
- Compaction-related injuries reduced 96%
- Fire hazard insurance premiums lowered
San Diego facility secured 18% insurance discount through risk reduction.
How to Choose the Best Cardboard Recycling Baler?
Capacity ceilings emerging early? Automation overcomplicating operations? Hidden maintenance surprises? Precision matching avoids costly mistakes.
Demand 50% larger chamber than current peak flows. Verify automatic tie reliability ≥99%. Require hydraulic component documentation. Confirm parts availability within 48 hours.
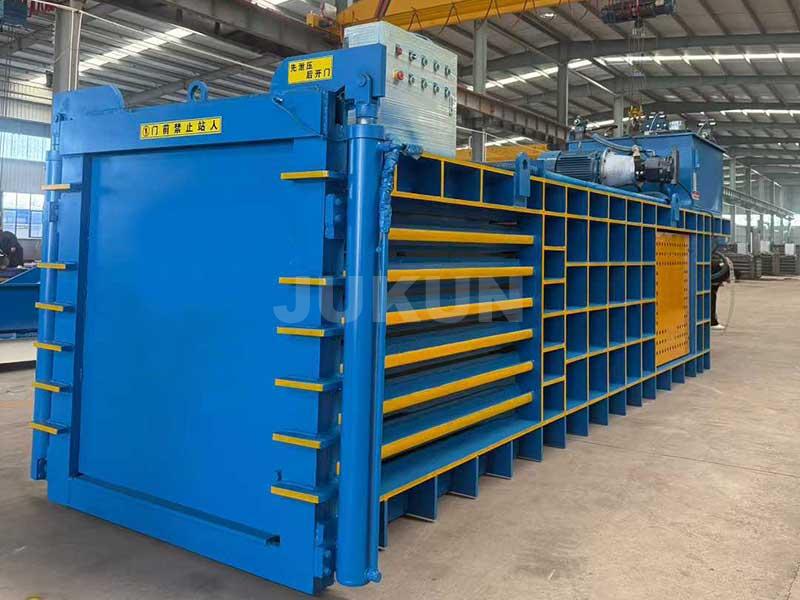
Five essential procurement factors
Hard-won industry experience:
Capacity Validation Formula
Required Chamber Size (ft³) =
(Daily Cardboard Volume × 1.7 Compression Factor) ÷ Material Density
Reality check: Underestimation consequences:
- Premature machinery replacement
- Overtime/material overflow costs
- Contract compliance penalties
Seattle plant avoided $86k error recalculating true peak volumes.
| Automation Tier Assessment | Automation Level | Hourly Output | Ideal User Profile | Labor Impact |
|---|---|---|---|---|
| Semi-Auto | 2-3 tons | Occasional generators | 40% reduction | |
| Fully Automatic | 5-8 tons | Daily high-volume streams | 70% reduction | |
| Smart Systems | 10-15+ tons | Industrial-scale recyclers | 85% reduction |
Minneapolis facility optimized spending by matching automation to actual flows.
Lifecycle Cost Analysis Must-review factors:
- Energy consumption certification (kWh/bale)
- Wear part replacement schedule
- Local service provider verification
- System upgrade pathway
- Hydraulic fluid efficiency ratings
Chicago recycler prevented $210k oversight during supplier evaluation.
Conclusion
Cardboard balers transform recycling operations through space optimization, cost-slashing compaction, and streamlined material flows - converting waste burdens into logistical advantages.