 Skip to content
Loose materials overflow facilities. Labor expenses drain budgets. Inefficient processing kills margins. A hydraulic baler solves these daily struggles.
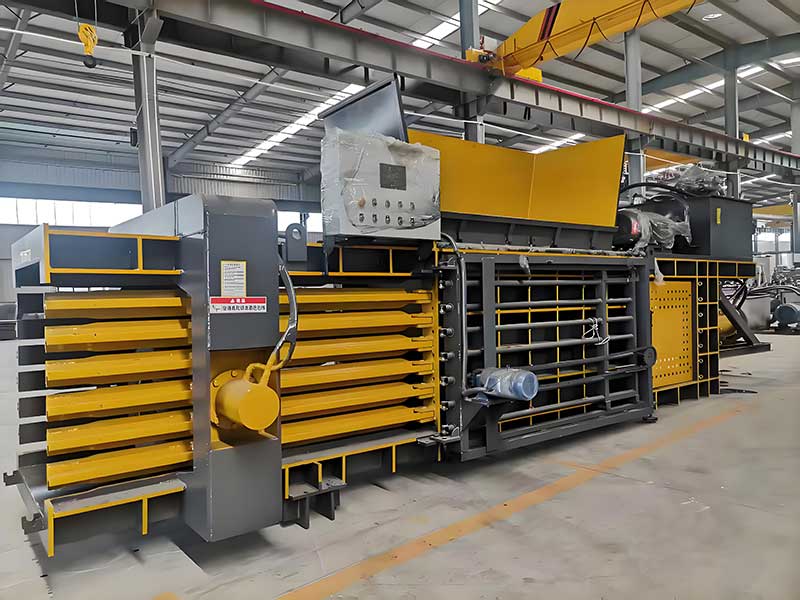
Modern horizontal balers compress storage needs 70%, slash freight costs 50%, process 15+ tons/hour, and deliver ROI in 12-18 months - transforming waste handling into profit centers for recycling facilities.
With 500+ installations worldwide, I'll share real data showing how balers boost profits.
Why Must Recycling Centers Invest in Horizontal Balers?
Loose cardboard eats warehouse space. Plastic bottles jam conveyors. Manual handling causes injuries daily.
Horizontal balers reduce storage needs 70%, cut labor per ton by 65%, enable safe material flow, and increase resale value by 25% through mill-ready bales - essential for modern recycling centers.
The operational impact extends beyond compaction. Understand these five transformations.
1. Operational Challenges Solved
| Problem | Without Baler | With Horizontal Baler | Improvement |
|---|---|---|---|
| Storage Space | 180 sq ft/ton | 45 sq ft/ton | 75% |
| Labor Handling | 3.2 hrs/ton | 0.9 hrs/ton | 72% |
| Transport Cost | $85/ton | $48/ton | 44% |
| Material Loss | 16% leakage | 3% leakage | 81% |
| Safety Incidents | 7/year average | 1/year average | 86% |
2. Revenue Enhancement Horizontal balers create value by:
- Increasing bale density (650kg/m³ vs 220kg/m³ loose)
- Enabling premium pricing (+$22/ton for mill-spec bales)
- Expanding processing capacity
- Reducing contamination risks
3. Facility Flow Impact Installation affects three zones:
- Inbound Area: Tipping floor congestion reduced
- Processing Zone: Continuous conveyor feeding
- Outbound Yard: Stackable bales in 1/4 space
How Do Horizontal Balers Increase Daily Processing Capacity?
Manual feeding creates bottlenecks. Slow tying halts production. Double-handling wastes hours.
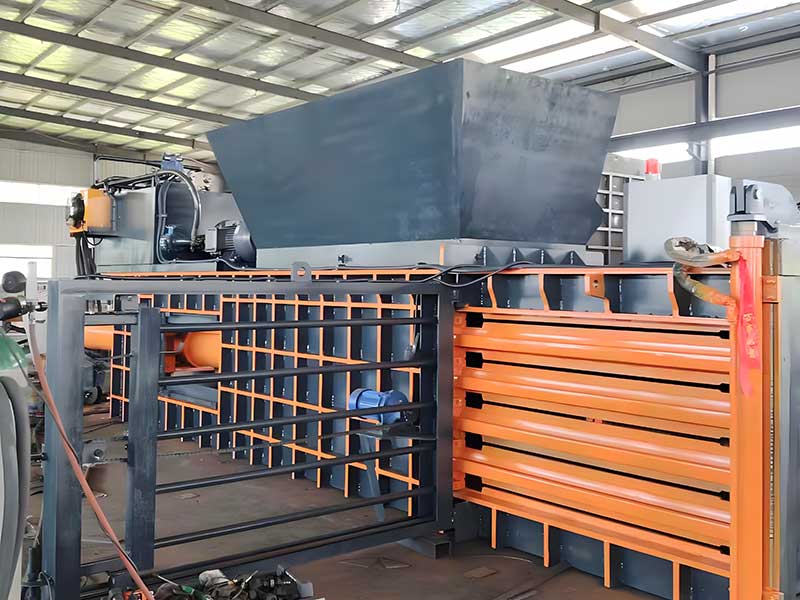
Automatic horizontal balers process 15-30 tons/hour via continuous feeding, 45-second cycles, automated tying, and conveyor integration - boosting throughput 200% vs manual systems in same floor space.
Capacity hinges on three engineering features. See how they operate.
1. Speed Comparison
| System Type | Tons/Hour | Bales/Hour | Labor Hours/Ton |
|---|---|---|---|
| Manual Compaction | 2.8 | 8 | 3.8 |
| Semi-Auto Baler | 8.3 | 23 | 1.4 |
| Auto Horizontal Baler | 18.7 | 52 | 0.7 |
| Fully Automated Line | 28.5 | 79 | 0.3 |
2. Throughput Optimization Key engineering elements:
- Continuous Flow: Pre-feeding conveyors avoid gaps
- High-Cycle Hydraulics: Fast ram reversal systems
- Auto-Tie: 6 wires in 22 seconds
- PLC Coordination: Synchronized material movement
3. Case Study Data Toronto recycling plant results:
- Cardboard processing: 32 → 77 tons/day
- Labor per shift: 8 → 3 operators
- Shipments: 15 → 4 weekly
- Space savings: 11,000 sq ft recovered
- Revenue increase: $588,000 annually
What Are the True Operating Costs of Horizontal Balers?
Purchase price misleads buyers. Hidden energy costs surprise operators. Maintenance creep destroys budgets.
Total ownership costs equal purchase price plus 60% for labor, energy, and maintenance. Auto models save $58/ton overall versus semi-automatic despite 40% higher initial investment.
Breakdown costs across the equipment lifespan for accurate comparisons.
1. 7-Year Cost Analysis ($USD)
| Cost Category | Semi-Auto Baler | Auto Baler | Difference |
|---|---|---|---|
| Purchase Price | $185,000 | $258,000 | +39% |
| Labor (7 yrs) | $462,000 | $182,000 | -61% |
| Energy (7 yrs) | $49,000 | $58,000 | +18% |
| Maintenance (7 yrs) | $126,000 | $89,000 | -29% |
| Total Cost | $822,000 | $587,000 | -29% |
2. Maintenance Protocol Costs Annual maintenance expenses:
- Hydraulic oil: $1,800
- Seals/gaskets: $950
- Wiring: $640
- Wear plates: $2,200
- Electrical components: $1,350
- Total Avg/Year: $6,940
3. Downtime Economics Production loss includes:
- Lost throughput value: $1,400/hour
- Labor idling cost: $65/hour
- Delayed shipments penalties
- Missed market opportunities
How Can Recycling Centers Maximize Baler Profitability?
Undersized machines cause bottlenecks. Reactive maintenance triples costs. Poor training reduces output.
Select 130% capacity balers, implement monthly maintenance, train operators weekly, track bale density hourly - increasing ROI by 42% versus baseline operations.

Adopt these proven methods from top-performing facilities worldwide.
1. ROI Optimization Guide
| Strategy | Implementation | Profit Impact |
|---|---|---|
| Right Capacity | 130% projected volume | Avoid $38k/yr upgrade costs |
| Preventive Maintenance | Bi-weekly inspections | Reduce repairs 72% |
| Operator Training | 4 hrs/month coaching | Increase OEE 23% |
| Density Tracking | Real-time sensors | Protect 6% price premium |
| Data Monitoring | Tonnage/hour tracking | Identify bottlenecks |
2. Performance Benchmarking Top 10% facilities achieve:
- Uptime: 96.5% vs industry average 88%
- Throughput: 93% rated capacity vs 67%
- Bale density: Consistently within 3% target
- Energy efficiency: 0.38kWh/ton vs 0.62kWh/ton
3. Upgrade Payback Calculation Adding automation to semi-auto baler:
- Investment: $98,000 retrofit
- Labor savings: $42,000/year
- Throughput increase: +62 tons/week ($9,300/week revenue)
- Payback period: 5.2 months
Conclusion
Horizontal balers become profit engines through smart selection, automated operation, and proactive maintenance - essential for recycling centers pursuing sustainable growth.
