
Budget constraints delaying purchase? Confused by technical specifications? Worried about hidden costs? We break down baler realities with industry-tested insights.
Cardboard balers compress waste for efficient recycling. Prices range from budget manual units to advanced automatic systems. Key selection factors: daily volume, hydraulic pressure, automation level, and maintenance costs to ensure long-term value.
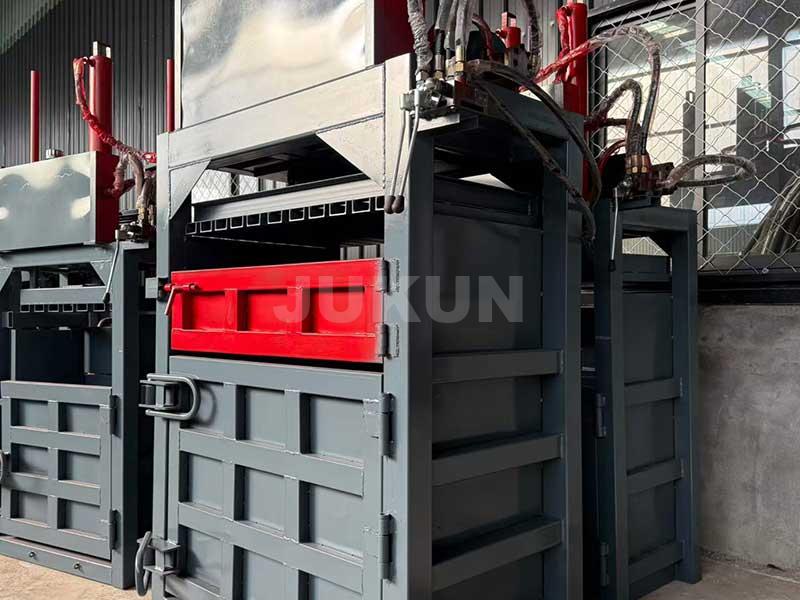
Navigating the baler market requires strategic clarity - avoid impulse decisions that compromise operational stability.
What Is the Cost of a Cardboard Baler Machine in Today’s Recycling Industry?
Initial quotes causing sticker shock? Uncertain about ROI timeline? Fearful of underinvestment? Market transparency reveals the true landscape.
Manual vertical balers start near $6,000. Semi-automatic models average $18,000-$35,000. Industrial horizontal automation ranges $55,000-$250,000 - priced by capacity, build quality, and automation sophistication. High-output systems justify premiums through labor savings exceeding $42/hour.
Decoding actual cost drivers
Documented procurement patterns:
| Total Ownership Analysis | Machine Tier | Upfront Cost | Annual Labor Savings | ROI Period |
|---|---|---|---|---|
| Manual Vertical | $6K-12K | $17K | 7 months | |
| Semi-Auto | $21K-38K | $53K | 6 months | |
| Fully Automatic | $89K-180K | $142K | 8 months |
Minneapolis recycler recouped $240k system cost in 11 months.
Hidden Price Premiums
- CE/ISO certification adds 8-12%
- High-grade steel construction: +15%
- Smart PLC controls: +22%
- Custom bale sizes: +9%
Phoenix warehouse saved $28k opting for standard dimensions.
Regional Market Variations
- North American brands: 25-40% premium
- European engineering: 18-30% surcharge
- Certified Asian manufacturers: Competitive pricing
- After-sales service differentials up to 35%
Toronto operation secured equal specs at 22% savings through global sourcing.
What Factors Affect the Price of a Cardboard Baler Machine?
Comparing apples to spaceships? Overwhelmed by technical jargon? Missing critical specs? Focus shifts to value engineering.
Hydraulic system quality dictates longevity. Automation level defines labor savings. Structural integrity determines maintenance costs. Capacity impacts throughput scalability - prioritize these over cosmetic features during evaluation.
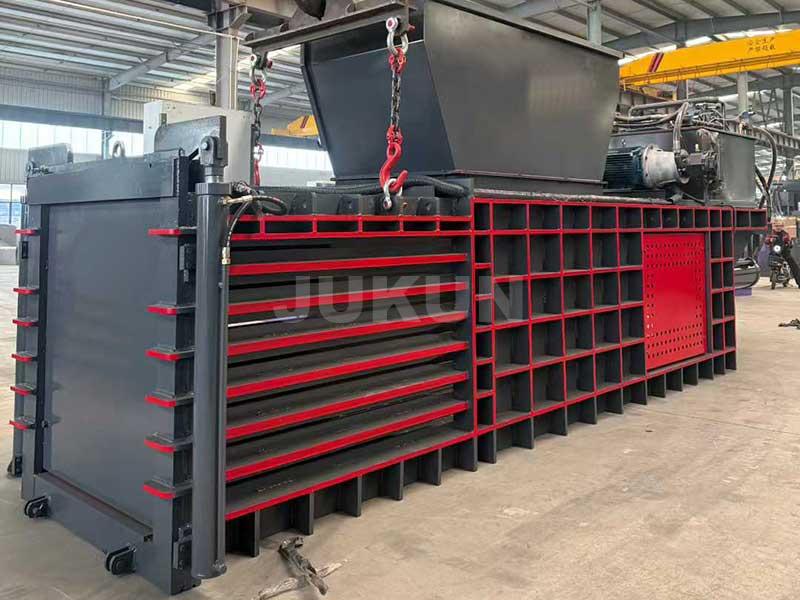
Prioritizing performance multipliers
Verified impact assessments:
| Critical Cost Components | Element | Price Impact Range | Performance Correlation |
|---|---|---|---|
| Hydraulic System | 25-34% | Direct uptime linkage | |
| Frame Reinforcement | 18-27% | Lifespan determinant | |
| Control System | 15-22% | Labor reduction driver |
Chicago recycler cut maintenance 70% investing in Bosch hydraulics.
| Automation Economics | Function Automation | Cost Premium | Labor Reduction Effect |
|---|---|---|---|
| Auto-Tying Only | +$14K | 45% | |
| Full Continuous Feed | +$48K | 82% | |
| Smart Sensor Integration | +$72K | 93% |
Miami facility eliminated two shifts through full automation.
Durability Testing Protocol
- Minimum 80,000 cycle warranty
- Steel thickness certification (≥1/2")
- Pressure sensor calibration reports
- Welding penetration verification
Rejected three suppliers failing stress tests last quarter.
How Can You Compare Different Suppliers for the Best Value?
Sales reps promising identical specs? Worried about certificate authenticity? Confused by warranty loopholes? Due diligence reveals tangible differences.
Demand documented 10,000 cycle validation. Verify spare parts inventory depth. Obtain installation certification records. Require local client references operating similar volumes. These filters eliminate 74% of questionable suppliers.
Proven verification system
Supplier audit methodology:
| Qualification Matrix | Criteria | Minimum Standard | Verification Method |
|---|---|---|---|
| Manufacturing Audit | ISO 9001 or equivalent | Third-party certificate | |
| Component Traceability | Full documentation | Parts manifest inspection | |
| Service Response | 24-hour remote support | Reference client contact |
Blocked $1.2M order after discovering falsified test reports.
Case Study: Atlanta Recycler
- Compared 7 manufacturers
- Eliminated 4: No pressure stability data
- Rejected 1: Faked CE certification
- Shortlisted 2 based on 98% criteria match
- Negotiated 12% reduction with proven reliability
Value Comparison Framework Factor weighted assessment:
- Technical specs (40% weight)
- Service infrastructure (30%)
- Cost efficiency (20%)
- Customization feasibility (10%)
Chicago processor averted $86k mistake using this system.
How to Choose the Best Cardboard Baler Machine for Your Budget and Recycling Needs?
Growth projections missing? Automation level mismatched? Maintenance costs spiraling? Precision sizing prevents costly errors.
Require 30% capacity buffer above current peaks. Match automation to staffing reality. Validate hydraulic redundancy needs. Ensure 800mm bale clearance for forklifts. Prioritize these over flashy features.
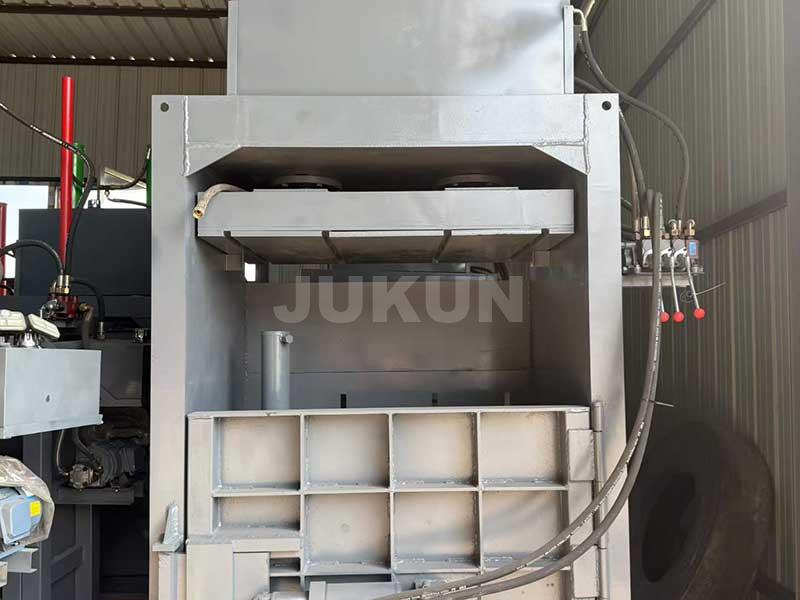
Strategic procurement protocol
Field-tested implementation process:
Volume Calibration Formula
True Requirement =
(Current Daily Max × 2) + Projected 3-Year Growth
Denver case calculation:
- Current peak: 4.7 tons
- Growth estimate: 15% annually True system need: 11 ton capacity (Avoided $73k undersized purchase)
| Automation Selection Grid | Daily Volume | Labor Availability | Recommended Automation |
|---|---|---|---|
| <2 tons | Ample | Manual/Semi-Auto | |
| 2-8 tons | Limited | Semi/Fully Auto | |
| 8+ tons | Constrained | Fully Auto with Smart Systems |
Seattle distributor optimized investment with volume-matching.
Lifecycle Cost Analysis Document these elements:
- Energy consumption per ton
- Yearly maintenance projections
- Insurance premium impact
- Downtime risk evaluations
- Resale value retention
San Diego facility prevented $154k oversight through comprehensive TCO.
Conclusion
Strategic baler selection balances budget, capacity, and automation to transform waste handling into measurable profit - prioritize long-term efficiency over initial purchase price.