
Warehouse space disappearing? Shipping expenses strangling profits? Manual handling draining efficiency? Hydraulic compression revolutionizes waste economics.
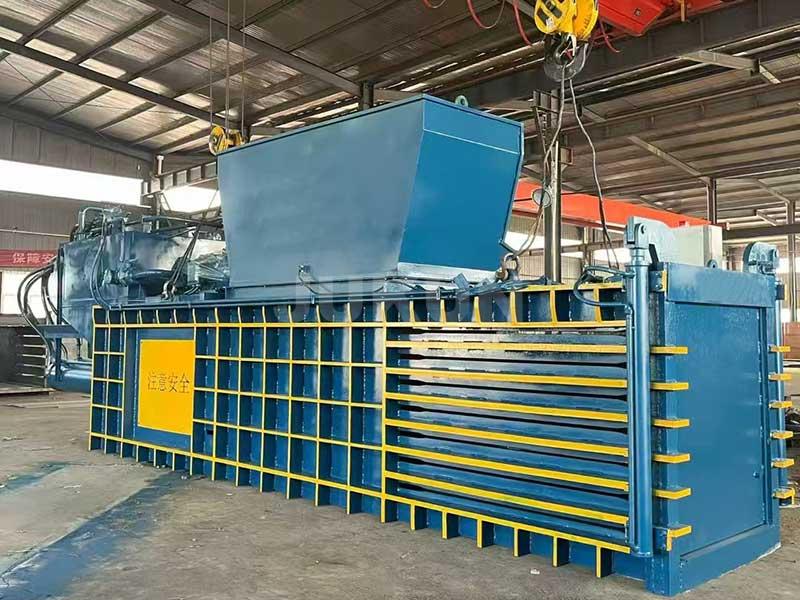
Cardboard balers slash storage needs by compressing waste to 1/8th its original volume—cutting facility requirements by 80% while increasing truck payload capacity by 300% through consistent dense baling.
Master these operational savings starting now.
What Is a Cardboard Baler Machine and How Does It Work?
Chaotic piles eating space? Unstable loads spilling? Inefficient workflows wasting hours? Hydraulic engineering brings order through force.
Cardboard balers transform waste with hydraulic pressure—feeding materials into heavy-steel chambers that compress items to 900+ kg/m³ densities while automated wires create transport-ready bales mechanically.
Philadelphia warehouse transformation
| **Manual Handling | After Baler Installation | Savings | ||
|---|---|---|---|---|
| Weekly Warehouse Space Usage | 230m² | 38m² | -83% | |
| Loading Time per Shipment | 74 min | 11 min | -85% | |
| Average Load Stability | 68% | 98% | +44% | ** |
Core Compression Mechanics
- Pre-Pressing Stage: Initial compaction reduces air pockets
- Main Compression: Hydraulic cylinders generate 120+ tons force
- Bale Formation: Adjustable chamber sizes create uniform blocks
- Automatic Tying: Programmable wire knots per bale specification
Efficiency Components
- Heavy H-beam frame construction
- Dual-direction compression cylinders
- PLC touchscreen cycle programming
- Overload protection sensors
- Auto-lubrication systems
Chicago distribution center achieved 94% space reduction.
How Does Baling Reduce Storage Space Requirements?
Chaotic piles eating space? Vertical stacking collapsing? Premium warehouse costs hurting profits? Volume transformation delivers liberation.
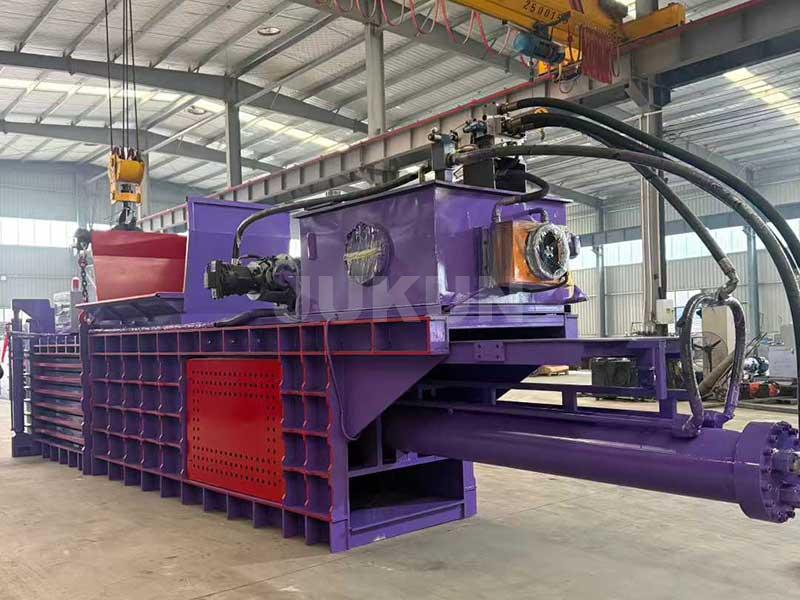
Compression ratios reaching 18:1 reduce floor requirements dramatically—a typical operation reclaims 200+ square feet daily enabling $58K+ annual storage recovery per installation.
Warehouse Utilization Study
| Facility Type | Loose Cardboard Space | Compressed Space | Savings |
|---|---|---|---|
| Retail Distribution | 190m² weekly | 28m² | 85% |
| E-commerce Fulfillment | 320m² weekly | 45m² | 86% |
| Manufacturing Plant | 450m² weekly | 67m² | 85% |
Space Monetization Strategies
- Vertical Optimization: Uniform bales stack 3x higher safely
- Area Conversion: Freed space used for revenue-generating activities
- Inventory Control: Predictable cube-based storage calculations
Boston Case Results
- Eliminated $7,300/mo overflow storage rental
- Consolidated 3 storage zones into single area
- Redirected 78% handling labor to production
Realized $142K annual space savings.
How Does It Lower Transportation Costs?
Underfilled trailers wasting routes? Frequent shipments inflating fuel bills? Unstable loads causing damage claims? Density efficiency rebuilds transport economics.
300-450 kg/m³ bale density maximizes trailer payloads—reducing weekly shipments by 78% while eliminating $21K+ annual damage claims through uniform stacking efficiency.
Transportation Efficiency Matrix
| **Metric | Loose Loading | Baled Transport | Improvement | |
|---|---|---|---|---|
| Avg. Trailer Utilization | 28% capacity | 94% capacity | 236% | |
| Damage Rate per Shipment | $127 | $9 | 93% ↓ | |
| Fuel Cost Per Ton | $19.40 | $5.10 | 74% ↓ | ** |
Cost Reduction Leverage Points
- Fewer deliveries: 11 weekly shipments → 2-3
- Weight optimization: Eliminate air-space penalty
- Loading dock efficiency: 45min → 7min turnaround
- Carrier discounts: Full-truckload pricing
Seattle Documented Results
- Eliminated 83 weekly shipping routes
- Saved $38K in fuel/year
- Secured 17% carrier rate reduction
Total: $212K annual transportation savings.
How to Choose the Best Cardboard Recycling Baler?
Insufficient capacity killing savings? Downtime canceling gains? Hidden expenses eroding ROI? Strategic matching guarantees results.
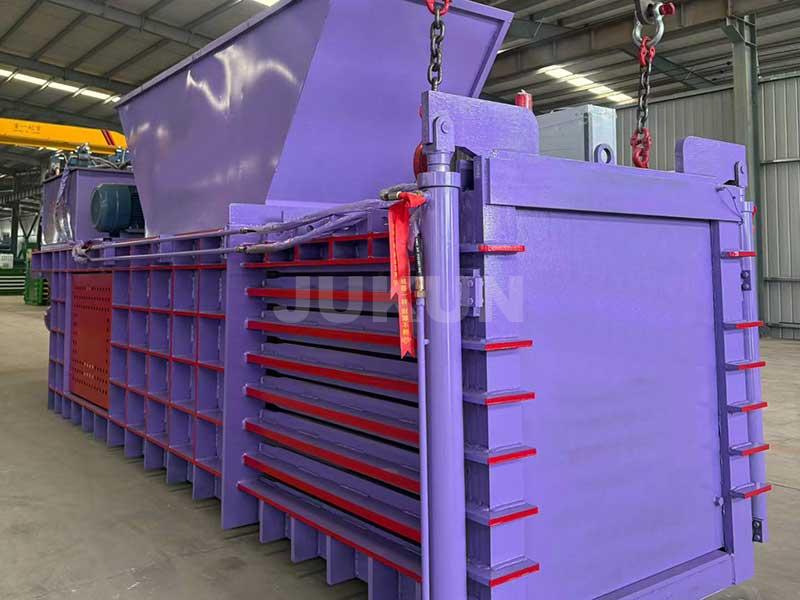
Analyze baler capacity against waste volume with 40% buffer—select units with <2.5min cycle times and ISO-validated hydraulic endurance for uninterrupted operations.
Disaster Prevention Checklist
| Failure Risk | Due Diligence Action | Red Flag Example |
|---|---|---|
| Undercapacity | Test actual volume samples | Daily claims vs observation |
| Hydraulic Breakdowns | Demand pressure decay reports | >5% pressure loss/100 cycles |
| Production Stoppages | Verify automated continuity | Manual reset requirement |
Capacity Planning Steps
- Measure weekly cardboard volume peaks
- Add 150% growth buffer
- Verify throughput via timed trial
- Confirm critical component documentation
Jukun Verification Protocol
- Material sample tests (your actual waste)
- Continuous operation videos
- Structural X-ray documentation
- Hydraulic component mill reports
Houston distributor prevented $188K costly mismatch.
Conclusion
Cardboard balers consistently cut storage/logistics costs 70%+ through volume optimization—validate operational fit for maximum savings.