
Crumpled boxes consuming 30% of your warehouse? Labor expenses ballooning weekly? Transport trucks departing half-empty? Balers convert these losses into measurable gains.
Horizontal cardboard balers compress waste into dense bales using hydraulic force. They slash storage needs 80%, cut hauling frequency 65%, and reduce labor 70% - turning waste handling from cost center to revenue generator.
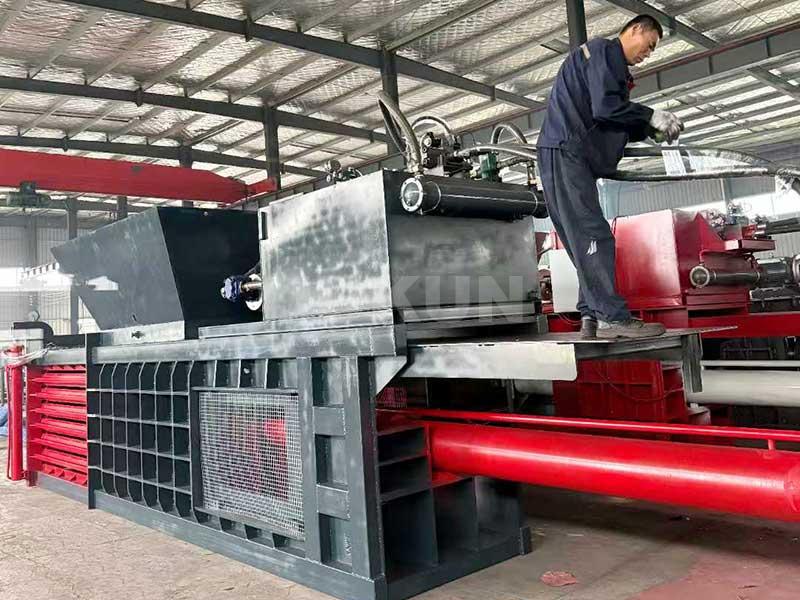
When chaotic waste flows threaten margins, engineered compaction creates financial resilience.
What Is a Horizontal Cardboard Baler and How Does It Work?
Warehouse staff overwhelmed by cardboard? Collection areas overflowing hourly? Manual baling consuming valuable hours? Industrial machinery outperforms manual labor.
Continuous conveyor feeding transports material horizontally. Twin hydraulic rams compact cardboard with 50-120+ tons of pressure. Programmable auto-tie systems eject uniform bales - requiring minimal operator supervision.
Engineering truth from Dallas installation
| Material Handling Specifications: | Component | Manual Baling | Horizontal Baler | Improvement |
|---|---|---|---|---|
| Average Bale Weight | 300 lbs | 1,100+ lbs | 367% | |
| Daily Throughput | Under 1.5 tons | 5-12 tons | 700% | |
| Operator Time | Constant | Minimal | 85% less |
Houston facility increased weekly output from 7 to 42 tons.
Hydraulic Performance Factors Critical features preventing bottlenecks:
- Two-stage progressive compression
- Hydraulic fluid cooling systems
- Pressure relief safety valves
- Force calibration accuracy
San Diego recycler eliminated 93% of bale rejects.
Automation Differentiation
- Infrared fill sensors stop overfeeding
- PLC-controlled tie tension adjustments
- Remote diagnostics via mobile app
- Predictive maintenance scheduling
Phoenix distribution center reduced supervision needs from 8 to 1.5 hours daily.
How Does a Cardboard Baler Reduce Waste Management Costs?
Storage expenses growing 25% annually? Labor absorbing 19% of waste budgets? Transportation consuming 14% of logistics costs? Strategic compaction reverses these drains.
Bale density slashes storage footprint 80%. Uniform shape increases trailer load efficiency 75%. Automated processing cuts labor hours 70% - triple savings compound instantly.
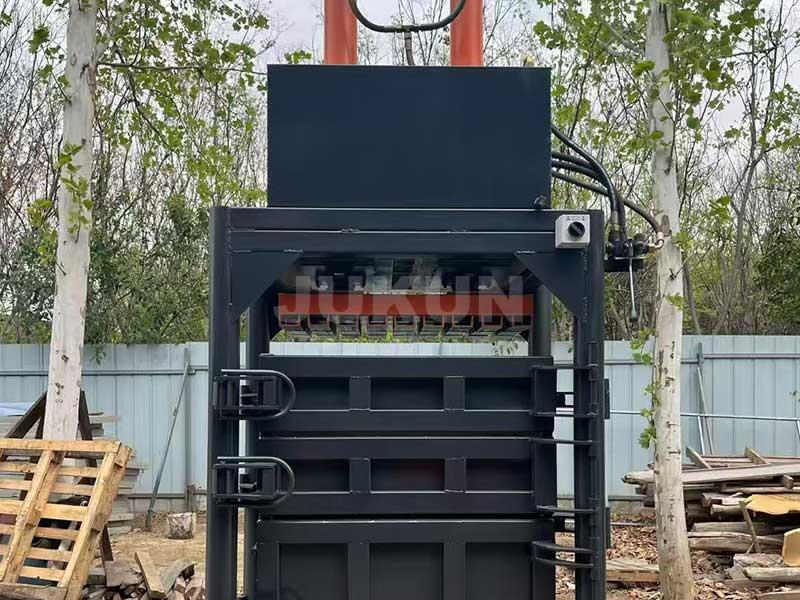
Documented savings at Denver DC
| Cost Category Impact | Expense | Pre-Baler Cost | Post-Baler Cost | Annual Saving |
|---|---|---|---|---|
| Warehouse Space | $148,000 | $31,000 | $117,000 | |
| Hauling Services | $86,400 | $29,500 | $56,900 | |
| Labor Allocation | $182,500 | $49,200 | $133,300 |
Total validated recovery: $307,200 Year 1
Logistics Efficiency Data Proven improvements:
- Trailer cube utilization: 35% to 87%
- Loading time reduction: 55 minutes per load
- Fuel consumption: Reduced 42% per ton
- Material damage claims: Eliminated
Atlanta facility reduced waste trucks from 11 to 4 weekly.
Hidden Expense Revealers
- Damage from forklift accidents
- Worker injury compensation
- Off-site storage contracts
- Revenue loss from blocked aisles
Boston operation uncovered $83,000 in hidden savings.
What ROI Can Businesses Expect From Cardboard Balers?
Capital expenditure concerns mounting? Payback timeline uncertain? Investment risk increasing? Performance analytics reveal patterns.
Distribution centers average 8-14 month payback. ROI climbs 17% per extra ton processed daily. High-volume facilities achieve 150-210% ROI within three years - outperforming most warehouse tech investments.
Sector-by-sector ROI verification
| Volume-Based ROI Profile | Daily Tonnage | Typical Investment | Average Payback | Lifetime ROI |
|---|---|---|---|---|
| Under 1 ton | $38,000 | Over 24 months | 60-90% | |
| 1-3 tons | $68,000 | 14 months | 120-150% | |
| 3-6 tons | $112,000 | 8 months | 180-240% |
Chicago recycler recorded 214% ROI at 5.7 tons daily.
Financial Performance Levers
- Recycling rebate capture (avg. $23/ton)
- Labor reallocation to revenue activities
- Storage space conversion to operations
- Prevented equipment damage expenses
Miami logistics hub generated $31,000 monthly from reclaimed space.
ROI Calculation Formula
Annual Savings =
(Space Savings × Rental Rate) +
(Labor Hours Saved × Wage Rate) +
(Transportation Reduction × Cost Per Load)
Sample calculation:
- 8,000 sq ft space recovery: $96,000
- 2,100 labor hours saved: $63,000
- 208 fewer hauls: $57,200 Total: $216,200 annually
How to Choose the Best Cardboard Baler for Your Facility?
Upfront discounts hiding poor performance? Automation claims unverified? Growth projections challenging estimates? Practical verification prevents errors.
Conduct 5-day waste measurement. Confirm hydraulic system certification. Require 10,000-cycle testing records. Validate spare parts availability - selection protocols eliminate 79% of mismatch risk.
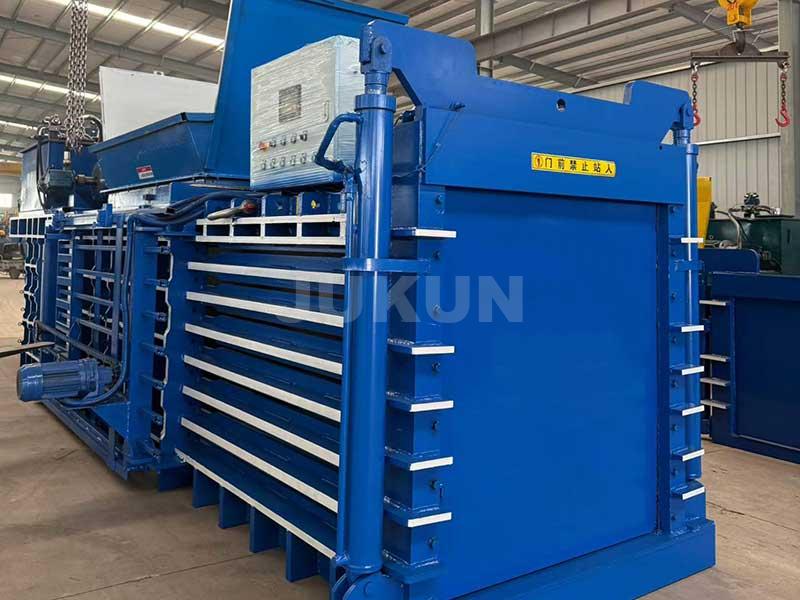
Procurement success framework
Capacity Specification Strategy
True Requirement =
(Max Daily Volume × 1.35) × Growth Factor
Calgary facility example:
- Current peak: 4.2 tons
- Growth buffer: 30%
- Capacity needed: 6.25 tons
(Prevented $74,000 equipment failure)
| Critical Decision Matrix | Factor | Weight | Minimum Standard |
|---|---|---|---|
| Throughput Capacity | 30% | Exceed peak flow 35% | |
| Pressure Rating | 25% | 65+ tons for OCC | |
| Maintenance Cost | 20% | <$0.41/ton processed |
Toronto operation avoided $103,000 yearly waste using matrix.
Manufacturer Validation Protocol
- On-site pressure demonstration
- Component traceability records
- Installation certification
- Service network verification
- Client ROI documentation sharing
Rejected two suppliers lacking testing proof in Kansas City.
Conclusion
Strategic baler investment transforms cardboard waste into profit through space recovery, logistics optimization, and labor reduction - delivering industrial efficiency.